Main message
Framework for drawing causal inference from observational studies:
- Treatment groups
- Patient-level outcome
- Summary measure of outcome
- Difference in outcome among groups
- Attribution to group membership
- Factors to control
- Factors we should not control
We published a study on timing alternatives for hip fracture surgery in CMAJ https://doi.org/10.1503/cmaj.171512
We offer two new estimates: projected mortality and attributable deaths.
How did we argue our case that early surgery improves survival after hip fracture?
- We state we are concerned with a policy question, not an associational question. We ask what mortality should be expected if timing policy for hip fracture surgery would change. An associational question is whether mortality varies in patients with various surgical times.
- We acknowledge that answering the policy question with observational data involves counterfactuals, such as expected mortality should all patients had early surgery.
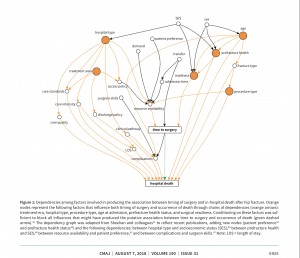
- We stratify observations on factors that block biasing influences from known factors. We use the back-door criterion to find stratification factors in a evidence-informed causal diagram.
- We observe stratification factors have constant values within each stratum. We reason then difference in mortality by timing is unbiased in each strata, because conditioning on statification factors prevents other factors from producing covariation in mortality and timing.
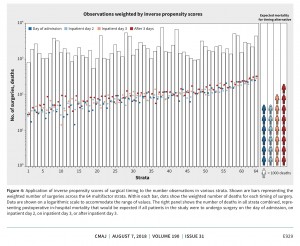
- We average stratum-specific risk differences between timing alternatives to find difference in mortality attributable to a policy change.
- We conclude that if all hip fracture surgeries in Canada were within 2 days, then 8 more patients would survive to hospital discharge, for every 1000 surgeries.
CMAJ August 07, 2018 190 (31) E923-E932


Is there a way to graphically depict two intervening variables that influence each other in a DAG? By definition, it is clear that a DAG is acyclic and cannot include bi-directional arrows. Yet, I wonder if there is way to allow for the inclusion of this type of relationship in a causal model.
Thank-you! More
Preparing a presentation at SPPH, I used Pearl’s counterfactual probabilities in the context of coronary revascularization.
More
I have updated definitions in the glossary on this web site and would welcome your comments. Suggestions for new entries are always welcome.
Heckman et al. (1997b) have argued that in a variety of policy contexts, it is the average treatment effect for the treated that is of substantive interest. The essence of their argument is that in deciding whether a policy is beneficial, the interest is whether it is beneficial for those individuals who are either assigned or who would assign themselves to the treatment, rather than whether on average the program is beneficial for all individuals.
Using structural model semantics, Pearl gives definitions of six counterfactual quantities. More
Suzuki et al. draw the distinction between the attributable cases and attributable proportions in their careful article in Am J Epidemiol. 2012;175(6):567–575.
More
My colleague, Adrian Levy, presented at the 2012 Harvard-Merck workshop Comparative Effectiveness Research: Controversies and Opportunities. The focus of the Workshop was on statistical, analytical and design methods of comparative effectiveness research in therapeutic interventions. More
by Boris Sobolev
/in
News/on June 02,
2012AHRQ made available for comments a new publication entitled, Developing a Protocol for Observational Comparative Effectiveness Research: A User’s Guide. This 11-chapter guide is a resource for investigators and stakeholders for developing observational comparative effectiveness research studies. More
In the patient care setting, we can only observe one possible treatment and one potential outcome for a given patient. Therefore, establishing the causal effect of treatment requires comparing the observed outcome and counterfactual outcome (i.e. a potential outcome for a counterfactual treatment).
I was presenting on the causal perspective in CER today, and a question came about connection between the claim that deaths are attributed to exposure and the claim that these deaths could be avoided had the exposure been eliminated. More
DAGitty is a GUI tool for constructing and analyzing Causal Diagrams. It was created by Textor and Hardt and is available at dagitty.net
I was presenting today on causal diagrams, and a question came whether the assumption behind an arrow is of associational or causal nature. More
In his engaging book, Understanding Health Services, Prof. Nick Black outlines several reasons. More

